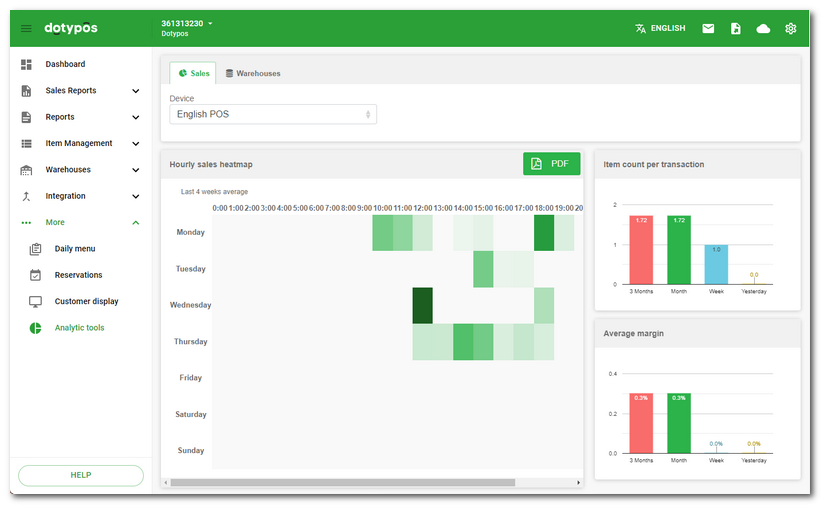
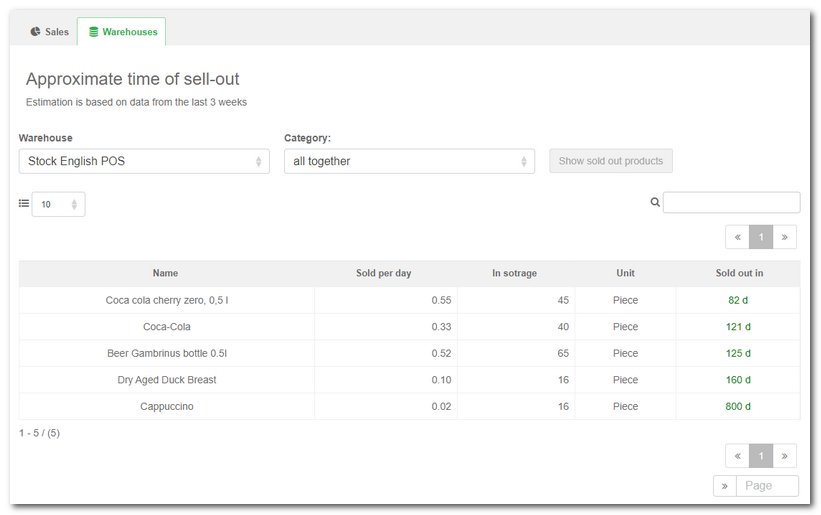
Analytic tools is a set of diagrams and important information from the cash register system. You can see here graphic representations of sales or stock information including predictions when the goods are likely to be sold out. The information is split between two tabs:
Sales
In the item Sales you will find several diagrams with graphic representations of sales. The graphs show data corresponding to the last 3 months, last month, last week and preceding day, if not stated otherwise below. The displayed information can be restricted just to the selected cash register. You will find there the following diagrams:
•Hourly sales heat map
Displays a thermal map of sales during the last 4 weeks. The overview can be exported to a .pdf file.
•Item count per transaction
•Average margin
To display the relevant information, the individual products must have the correct margin settings.
•Transaction per day
•Average transaction value
The graph displays the average of the data from the graph Profit from categories.
•Profit from category (3 months)
Shows the most profitable categories during the last 3 months.
•Week sales
Displays the total amount of sales during the last 12 months in sums per week.

Warehouses
The item Warehouses offers an overview of individual products, with information about average daily sales and current stock. On the basis of this information, the tab displays an estimate about the time to the likely out-of-stock status. The calculation is based on sales in the past three weeks where the highest calculation weight is represented by last week’s sales. Estimated sales for days are differentiated by color (green / yellow / red) according to the days remaining. This analysis can be used for the order planning of new goods.

|
We are planning the further development of analytic tools. Later, we will add more possibilities, e.g. a user-defined time period for the selected graph and more options for data selection. |