The Reports tab displays various types of new data reports. These reports can be filtered for a selected time period and for all or just a specific cash register. The reports also offer a wide range of editing options.
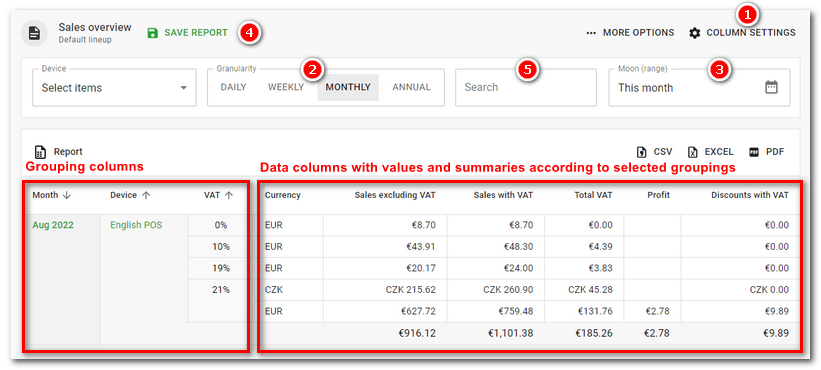
Data in reports can be grouped according to the so-called grouping columns. According to the selected first grouping column, you determine the basic sorting of each report. You can set the displayed columns and their order for each report using the COLUMNS menu  in the header. You can click on the column header to sort the grouping columns. Thus, for each report, there are columns to group the data based on and columns to display the grouped data.
For example, if you set the first column Month and the second Cash register in a report, the data will be displayed by month and then by POS device. If you swap the order of the columns, the data will be grouped by each cashier and then sorted by day. The other so-called data columns, which you can also set, will display individual items, e.g. receipts issued and their total or average for the selected grouping (selected grouping columns). You can set the grouping period in the menu  . If you choose here instead of DAILY e.g. WEEKLY, the first column Day will be replaced by week and the data will be grouped by week. The interval for the displayed dates is set using the calendar
  . It is also possible to set the time range of the displayed data here. If you set the end time, for example, to 23:59, all records up to 23:59:59 will be displayed. If you enter the time 00:00 - 23:59, records from 00:00:59 to 23:59:59 will be displayed.
Once you are comfortable with the report setup, you can save it under its own name  and use it anytime later. This gives you the option to create your own reports and work with them. You can find the reports saved in this way in the left tab bar as Saved. You can export report data to Excel, .csv or .pdf format. The export buttons can be found in the header of each report.
Each report has a  field for fultext search and the ability to activate a custom end of day. You select the custom end of day in Cloud Settings and then turn it on here using the
  switch. If the End of day is enabled here, the data in the reports is displayed at the interval of the set end of day. So if you set the end of day to 2:00. Will the data reflect the "day" interval from 2:00 to 2:00 of the following day. This is useful, for example, for plants that operate over midnight.
|
In case you own a Dotypos EASY license, you do not have access to all offered reports. |

How to work with reports?
We will show the basic report options in the sales report Sales overview. This report is also referenced in the Sales report. The sales reports are therefore just links to the prepared corresponding reports.
|
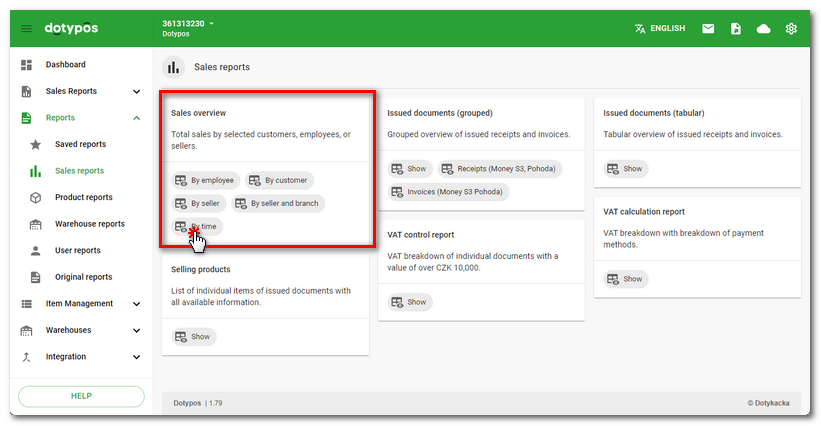
Expand the Reports tab and tap on Sales. From the reports menu, select Sales overview by Time. |

|
You will be taken to a report page with a summary of sales from all or selected cash registers |

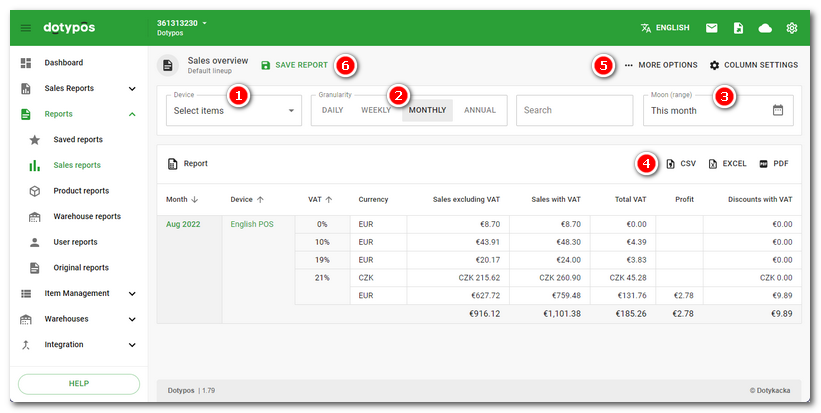
•Select the Device drop-down menu to limit the overview to a specific cashier or cashiers. The list also shows previously deleted (inactive) cash registers that have been replaced by a new device in the past. Click in the field to set the time period of the report.
•Click on the buttons in the section to choose whether the overview will be displayed by day, week, month or year. Depending on the period selected here, the display and options of the calendar will also be adjusted. For example, if you select WEEKLY view here, the calendar will directly offer the individual weeks.
•The MORE FILTERS option offers a limitation of the displayed data (filter). For the Sales overview report, you can limit the data to selected employees, customers or individual sellers. If nothing is selected here (default setting), the data is displayed without restriction. As soon as an item(s) is selected, the data will be restricted to these items only, i.e. the selected customer or employee. By clicking the cross, you remove the filter you added.
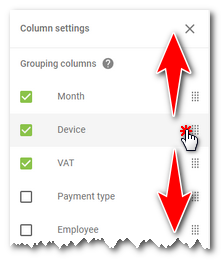
•By clicking on COLUMNS you can set which columns will be displayed in the report and also edit their order by dragging and dropping:
|
If you select the Daily view (Granularity) in the Sales report, you will be able to add an Hour column to the report that groups sales within each hourly interval. |

•If you customize the report, you can save it under your own name and description by selecting . You can find saved reports in this way in the left tab bar as Saved reports.
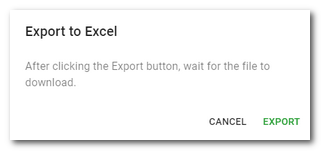
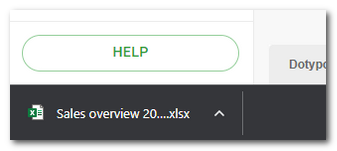
•You can also activate a custom end of day in the part and save the report to Excel, .csv or .pdf format via buttons. The file generation is instantaneous. After pressing the button to export to the selected format, it is necessary to wait for the exported data file to be completed and downloaded. In this case, the file will be automatically downloaded to the Downloads folder or other folder according to your browser settings. The procedure for generating the original (previous) reports is described in this chapter.
 |
 |
|
In the case of exporting reports and overviews to .pdf, the generation is limited to a maximum of 1000 items. If the data in the exported report contains more than 1000 items in total, the exported .pdf file will not contain individual items, but only summaries / totals for all items. Thus, the summaries always match regardless of the number of items. |

|
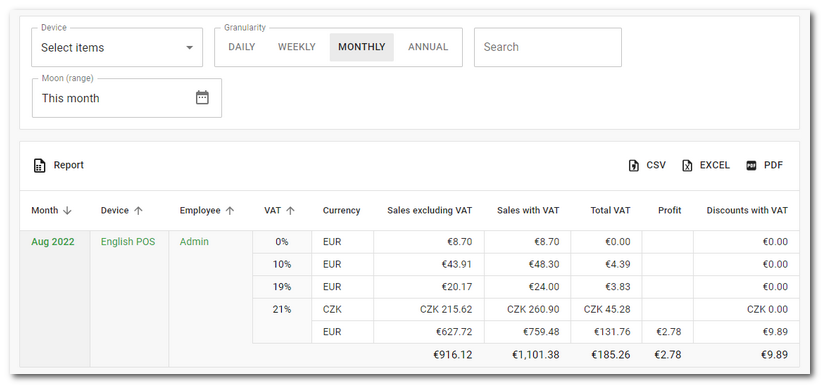
By removing or adding a specific column and its order, you determine how the data will be grouped in the report. In the image below, we have added the Employee column and moved it to the third position. So the report now shows the sales totals for the month, the cash registers and the individual employees. Some items in the report are an active link. Clicking on Admin in the Employee column opens a new page with the properties of that employee. Clicking the cash register name takes you to an overview of the documents issued at that cash register, etc. Click on the columns by which the data is grouped to sort them in ascending or descending order. |

|
The displayed data can be filtered by time period by clicking in the Date field For more information, see the chapter Filtering data by date. If you have your own end of day active, the calendar will take it into account. |

 section to set the most common time period directly. You can then use the calendar to select a custom interval. First select the month and year
  , then mark the specific start day
  . If the month and year match, you can also mark the start day. The selected start day will be highlighted. Then select the ending day in the same way. The entire interval will be marked in the calendar and the displayed dates will correspond to this interval. The switch
  displays at the bottom of the calendar the option to select a time interval for the selected period.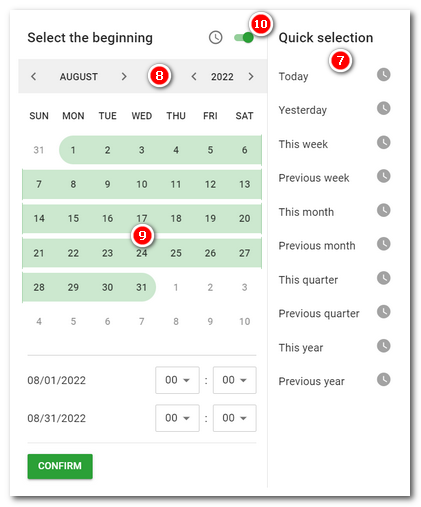
|
•Dotypos Cloud remembers the report settings. If you reopen it later, it will be displayed in its last set state. At the same time, based on the current calendar date, the corresponding period will be displayed automatically if it has been set. So if you set the calendar in the Quick Options to This month, the next month will display the dates from the current month and not the previous month. •If a large number of dates are displayed, the dates are loaded automatically as you scroll with the mouse. So there is no classic pagination. |