On the Reports tab, you will find a variety of data reports that display various cash register data. The availability of reports depends on the purchased Dotypos license. The individual data reports are divided into the following areas:
•Saved - An overview of all user-modified and saved reports.
•Sales - Data reports related to sales and revenue. Here you will find revenues divided by various criteria, a summary of tips, visits with average spending, summaries of individual shifts and closings, VAT breakdowns, lists of issued documents and open orders.
•Products - Revenues overviews by categories, products, employees, customers, or tags. You can also find an overview of sold products, including their customizations and created ingredients.
•Werhouse - Reports related to inventory management. These reports provide information on the current inventory status, margin and profit for a specific period, or the value of sold stock. You will also find stock movements, an overview of write-offs, or recipes by product and inventory.
•Employees - All data related to your employees. There are various views of attendance, shifts and closings, or information about login / logout of users to the cash register. This tab also contains sales per employee, broken down by sold products.
•Customers - All data related to customers, or rather customer accounts in the cash register. This includes detailed information about customer accounts, including current point balance or customer credit. You can also find a summary of reservations or sales by customers broken down by purchased products.
•Exports - Invoice and receipt exports to accounting systems Money S3 or Pohoda. Saving selected cash register operations to an audit file for internal use.
You can switch between report areas using the left item panel or the header:

Each data report contains so-called grouping columns that allow for custom sorting of data. If you select the Cash register grouping column in the report, records will be divided by individual registers. If you then add a Category column, records will be divided first by cash registers and then by categories. This is shown in the following image:
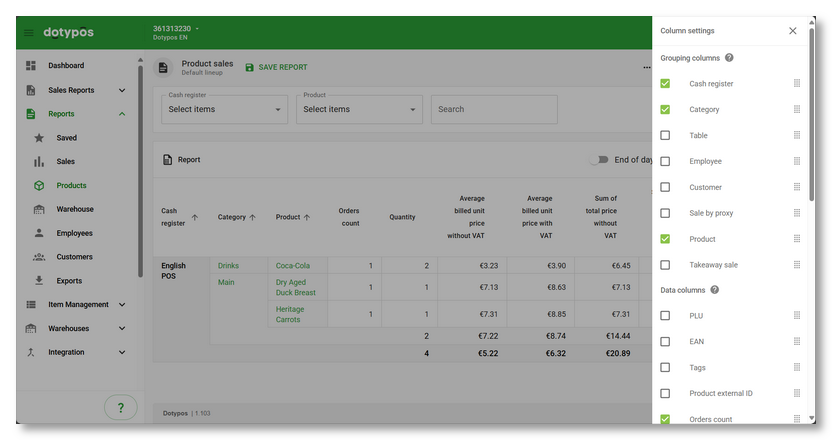
Grouping column order can be changed by dragging them, allowing you to define how the data is sorted in the report. Grouping columns consolidate all rows with the same value into a single row. Data columns then display the count, average, or sum of selected data. For more information on how to work with reports and filter displayed data, refer to the next chapter.
|
You can customize each data report and save it under your own name with a description. Learn more about saved reports in this chapter. |