Overview is the first page that opens after logging into Dotypos Cloud. It provides basic information and a well-arranged overview about cash registers and how they are functioning. Only if you have created multiple clouds (storage sites), will you be given, before the overview page, a choice of individual clouds. Some information in the overview can be filtered just for the selected currency. That matters when you are selling products in both CZK and e.g. EUR.
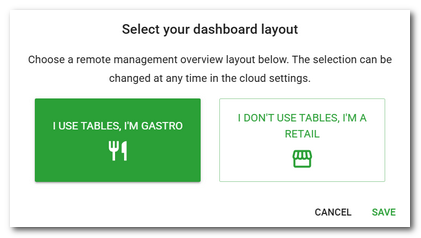
After the first login to the Dotypos Cloud, a dialog will appear allowing you to choose the form of the displayed information with regard to the area of your establishment (Gastro - pub, restaurant, bar / Retail - shop, newsagent, beauty salon). In the case of a selected shop, for example, the table occupancy is not displayed in the overview. The order of the information elements will also be slightly different from the example below, which shows the layout for Gastro. The option can be changed later at any time in Cloud Settings.
|
Press the DETAIL button in the selected information items in the overview to open the related data report or a pop-up window with the option to browse up to the last 500 records. Click the DETAIL button in this window again to open the related data report. |
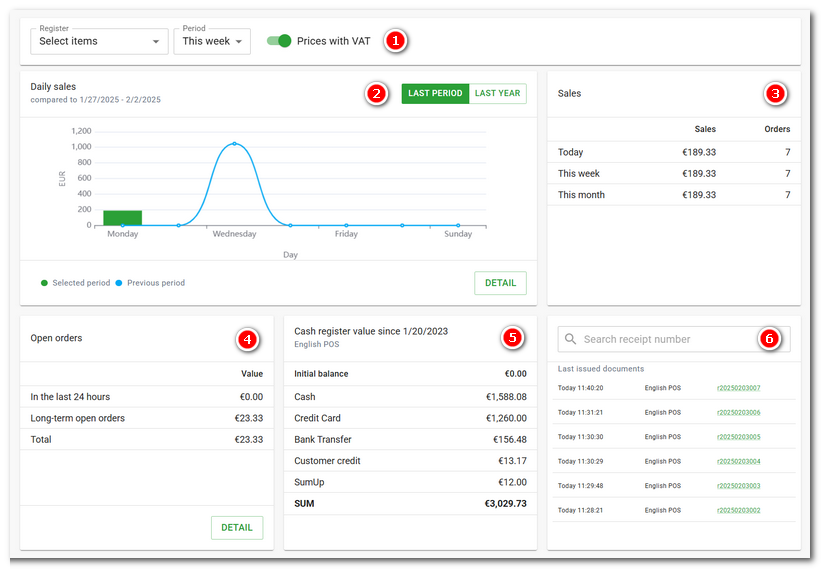
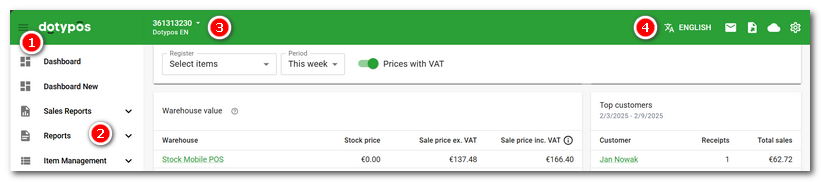
Information and elements at the top
Information in the middle section
Navigation elements on the page
Information and elements at the top
|
If you select specific cash registers, only data from these cash registers will be displayed (without selection, data for all cash registers is displayed). The same is true for the selected period. The TODAY option displays today's data and affects the data displayed in all parts of the overview. |
|
Comparison of the amount of sales for the currently set period in the panel |
|
The total sales for each period including the number of receipts issued. By clicking on OPEN ORDERS in the header, you can switch the element to display the value of currently open (unpaid) accounts. |
|
Sales broken down by the payment methods used from the last opening until the possible closing of the cash register. |
|
The value of the selected cash register since the last opening until a possible closure of the cash register, i.e., the value of all executed cash register transactions. To display this information, you need to select a specific cash register in the top panel |
|
Last issued receipts with the possibility to search based on the receipt number. / Payments made by card via the linked Dotypay terminal. Use the PORTAL button to open the login page to the Dotypay portal. |


|
If you have set a custom end of day, the data is displayed at the interval of the set end of day. So if you set the end of day to 2:00. The data will reflect the "day" interval from 2:00 to 2:00 of the following day. This is useful, for example, for plants that operate over midnight. |
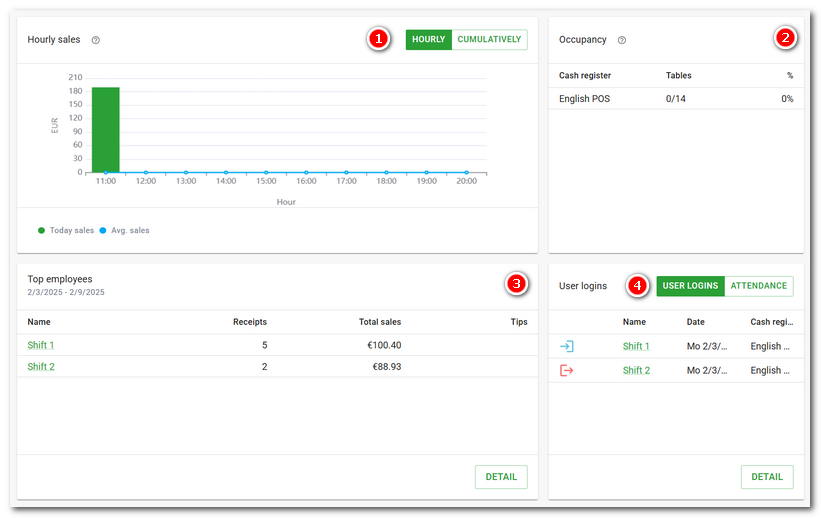
Information in the middle section
|
Average hourly sales calculated based on same-day sales during the previous 4 weeks. The cumulative graph then shows the hourly sales added together, i.e. the new sales are added to the previous ones and at the end of the day (last hour) the graph shows the final total sales of the cash register. |
|
The current table occupancy at each cashier shows the number of tables / occupied tables + total occupancy percentage. If the table map is not active at the cash register, the overview is not displayed. |
|
Ranking of employees by total sales. |
|
Information about registered employees or current attendance of employees with hours worked in a month. If you do not use the attendance system, only the login information will be displayed. |
|
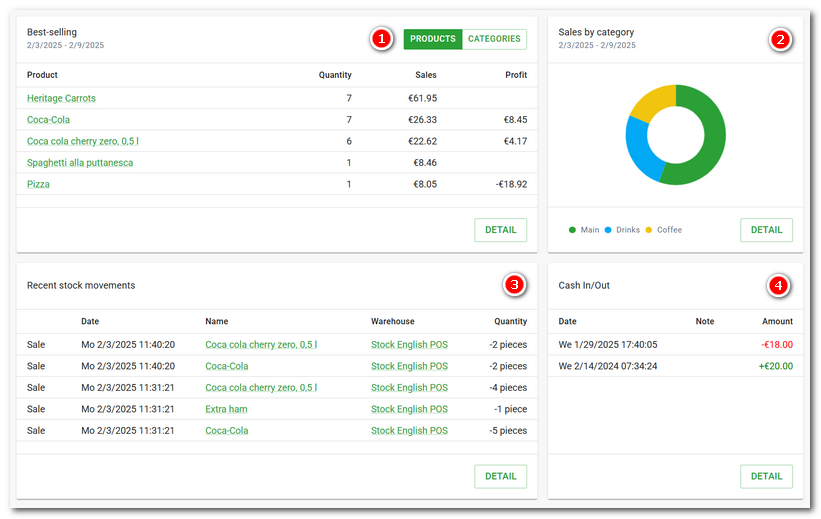
Products and categories sorted by sales, profit and margin. |
|
Share of sales by all categories. |
|
Overview of recent stock movements. |
|
Overview of cash receipts and expenditures. |
Information at the bottom
|
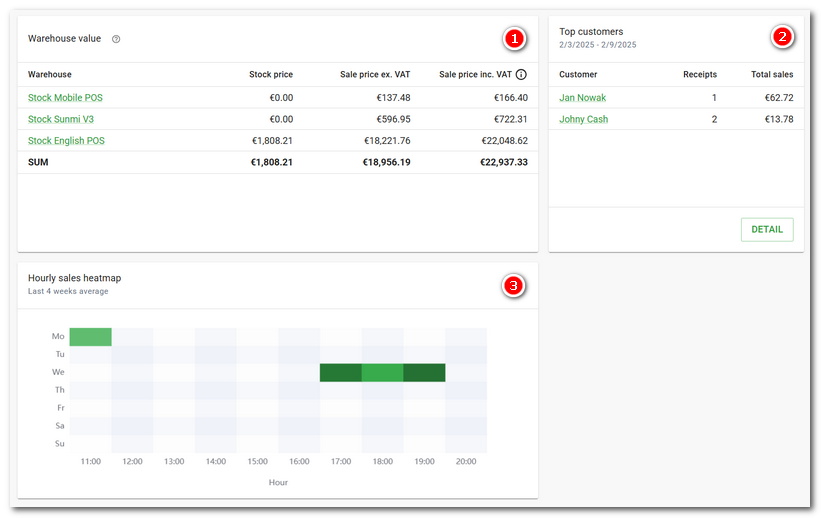
The current value of each warehouse (the total value of all warehouse products in each warehouse) and the current value of all warehouses (the total value of all warehouse products). The overview includes products that are not removed, have an active deduction from inventory, and have a positive inventory quantity in the inventory value. |
|
Ranking of customers with the highest spending. |
|
Overview of sales by day and hour in the form of a heat map. The darker the colour, the more sales were made at that time. |
|
Average spending per guest. The data draws from the average revenue per specified number of guests served. |
|
If you click on an item in the rankings (products, employees, customers...), you will be taken directly to the page of the record and can edit it. |
Navigation elements on the page
|
To hide / show the Item panel |
|
|
|
|
|
Quick Menu - Language settings / Messages / Cloud settings / Cloud options / My Dotypos / User Settings / Logout |